
MEWAR’S SUN ON THE FALL
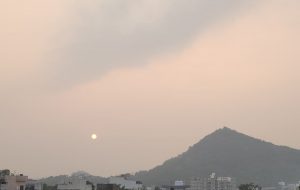
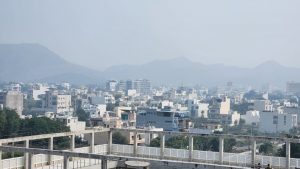
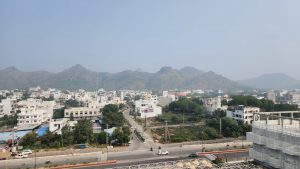
A brief on Udaipur’s air, health and the responsibility of this generation The Maharanas traced their lineage to Surya. In the City Palace, he appears again and again — in brass, in paint, in stone. Courtyards, doorways, and homes across the old city were aligned to welcome light. This was never decorative. It was an identity, built into architecture. Udaipur was shaped with an understanding of climate, air, heat, shadow, and breath. Today, that relationship is thinning. Not by war. Not by attack. But by neglect. The sun still rises. But increasingly, it rises behind a veil. Dust and smoke now sit between the sky and the city. The white of marble looks grey. The horizon looks tired. This is air pollution. Udaipur is officially classified as a Non – Attainment City under India’s National Clean Air Programme. In simple terms, the air here regularly fails to meet national safety standards for particulate matter.
Two pollutants dominate –
● PM10 – Coarse dust from broken roadsides, unpaved shoulders, construction, debri and disturbed soil.
● PM2.5 – Fine, invisible particles from diesel engines, generators, burning waste and combustion.
Key Statistics & Trends (Early December 2025):
● Current Levels: Around December 8-9, 2025, Udaipur’s AQI hovered in the low 100s (Moderate/Poor), with PM2.5 levels around 33-58 µg/m³, which is 3.8x the WHO guideline (15 µg/m³).
● Daily Fluctuations: AQI can vary significantly, with peaks exceeding 170 (Poor/Unhealthy) and lows dropping to 100-120.
● Seasonal Impact: Pollution is generally worse in winter (November-February) and improves during monsoon.
● Udaipur’s Position: While Udaipur isn’t always the worst, its AQI often trends higher (more polluted) than the ‘Satisfactory’ (51-100) or ‘Moderate’ (101-200) benchmarks for large parts of India, especially in winter, making it a city of concern.
What This Means:
● Moderate (101-150): Sensitive individuals (children, elderly, respiratory issues) should reduce prolonged outdoor exertion.
● Poor (151-200): Everyone should limit outdoor activity and wear masks.
The Risk: Cigarettes We Never Smoked
There is a way to understand air pollution that is impossible to ignore. A widely accepted measure states: 22 micrograms per cubic metre (µg/m³) of PM2.5 for one day is roughly equal to smoking one cigarette. On the worst days in Delhi, breathing the air is compared to smoking 40–50 cigarettes a day. Udaipur is not Delhi. But Udaipur has repeated days in the “unhealthy” range. This means many people here are effectively “smoking” several cigarettes a day — without ever touching one. Children. Elderly. Students. Traffic police. Vendors. Workers. The damage is quiet.
What Is Actually Polluting Udaipur’s Air?
Udaipur’s pollution is not complex. It is local. And it is human – made.
The major sources are –
• Road dust from broken shoulders, unpaved edges, loose soil, debris.
• Uncovered transport of sand, marble, soil and construction materials.
• Diesel vehicles – Especially old buses, trucks, tempos.
• Generators in hotels and construction sites.
• Open burning of waste, leaves and debris.
• Poor traffic flow and long idling times.
• Lack of green cover and inadequate dust – trapping vegetation
• Unsafe or absent footpaths forcing even short journeys onto vehicles every passing vehicle disturbs dust.
The Real Solution: Air Is Infrastructure
To reduce PM10 and PM2.5, the city must directly address the physical and behavioural sources –
• Stabilise road edges – no loose soil, no crumbling shoulders.
• Eliminate open burning completely.
• Phase out the worst diesel vehicles and generators.
• Improve traffic flow to reduce idling.
• Increase urban tree cover in high – pollution corridors.
• Commission a scientific source-apportionment and health – impact study for Udaipur.
These steps together can realistically deliver a 30–50% reduction in particulate pollution within three years, in priority zones. This is not a technological challenge. It is an administrative and cultural one.
Sources & Data Basis –
• Central Pollution Control Board (CPCB), Government of India — official PM10, PM2.5 data, Continuous Ambient Air Quality Monitoring (CAAQMS), and National Ambient Air Quality Standards (NAAQS).
• National Clean Air Programme (NCAP), MoEFCC — Udaipur’s official classification as a Non-Attainment City and related City Action Plans.
• Rajasthan State Pollution Control Board (RSPCB) — regional air quality and emissions documentation.
• World Air Quality Index / OpenAQ / AQI India — real-time and historical AQI, PM10 and PM2.5 trends for Udaipur.
• World Health Organization (WHO) — health impact guidelines for particulate matter exposure.
• Indian Council of Medical Research (ICMR) & Global Burden of Disease studies — links between air pollution and morbidity/mortality in India.
• Peer-reviewed research (The Lancet, Nature, TERI, IIT Kanpur/IIT Bombay/IITM) — source apportionment, emission patterns, and health effects.
• Udaipur District Environment Plan & NCAP City Action Plan — officially recognised local pollution sources (road dust, vehicles, construction, waste burning, generators).