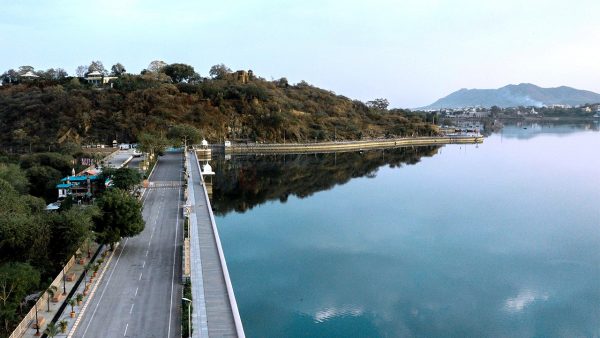
As the industrial units, vehicle movement and tourist places in the city come to a halt while people being locked inside their houses, the level of pollution has reduced drastically allowing the city to breathe some fresh air.
And due to the reduced air and water pollution, the amount of oxygen in the city’s lakes has also increased.
While one cannot deny the fact that COVID-19 lockdown has severely strained the livelihoods of lakhs and played havoc with the economy. But if we look beyond the quarantined homes, there is a see a city in bloom. Blissfully unpolluted, greener and cleaner, Udaipur is reliving the memories of an era long gone.
The most dramatic turnaround has been water quality in the lakes of the city.
The lockdown has come as a blessing in disguise for these lifelines of the city. And there are visible signs that the two of most popular lakes of Udaipur — Fatehsagar and Pichola – are getting healed naturally. With major pollutants like boat ferries shut down and minimum human interference, the lockdown is having a profound impact on the city’s environment.
If we look into the before and after the lockdown figures of the lake water purity measurement from the Pollution Control Board, there has been a substantial improvement in the purity of the water.
The increased level of oxygen has also enhanced the clarity of the water making the base of the lakes visible.
As per the sources, the Pollution Control Board takes the water sample every month to study the pollution level.
The following table gives a clear picture of how much polluted the water of the lakes was before the lockdown and how the lockdown has given a new life to these waterbodies of the city.
| Before Lockdown | After Lockdown | |||||||
| Lake | DO | pH | EC | TDS | DO | pH | EC | TDS |
| Pichola | 6.8 | 7.9 | 500 | 442 | 8.2 | 8.16 | 591 | 413 |
| Fatehsagar | 07 | 8.3 | 560 | 454 | 8.8 | 8.70 | 663 | 398 |
| Udaisagar | 05 | 8.6 | 1000 | 885 | 6.8 | 8.71 | 1265 | 885 |
| Swaroop Sagar | 06 | 8.2 | 500 | 408 | 7.6 | 8.43 | 538 | 376 |
| Goverdhan Sagar | 05 | 8.2 | 800 | 596 | 6.4 | 9.8 | 852 | 596 |
| Badi Lake | 08 | 8.4 | 400 | 300 | 8.8 | 8.63 | 410 | 287 |
| Jaisamand Lake | 07 | 7.2 | 500 | 400 | 8.8 | 8.57 | 558 | 390 |
Source: Patrika
- DO – Dissolved Oxygen
- pH – Potential of Hydrogen
- EC – Electrical Conductivity
- TDS – Total Dissolved Solids


